Silver: A Random Walk With Drift — Largely Unpredictable in the Short Run, With a Real Upward Trend Over Decades
- May 29
- 11 min read
Updated: Jul 16
Every major silver spike in 50 years was triggered by speculation, not fundamentals. The industrial thesis is real — but it doesn't move price the way most investors think.
Prepared by Richstorm.co

Key Takeaways
Silver is now majority an industrial commodity, with 59% of demand coming from industry — not a monetary metal.
Copper cannot replace silver in solar cells at commercial scale for at least another decade due to the 25-year warranty validation constraint.
Industrial demand and silver price have almost no meaningful correlation — price is driven by speculation and macro sentiment, not fundamentals.
Silver is best understood as a random walk with drift — largely unpredictable short term, but with a real upward trend over decades.
Hold silver for the drift, size for the noise, and never confuse the narrative with the signal.
Silver occupies a unique and frequently misunderstood position in investment markets. It is simultaneously a monetary metal, an industrial commodity, and increasingly a critical material for the technologies that will define the next two decades — solar energy, electric vehicles, AI infrastructure, and electrical power infrastructure upgrades. Most investment commentary focuses on one of these identities at the expense of the others, producing analysis that is either too bullish or too dismissive.
This report takes a science-first approach to silver's investment case, examining five decades of supply, demand, and price data alongside an honest assessment of the structural forces that are genuinely changing — and those that have been overstated before.
Silver Is Not What Most Investors Think It Is
The first thing to understand about silver is that its common mental model — a monetary metal that moves with gold and rises during crises — is now significantly incomplete. As of 2024, industrial applications account for approximately 59% of total global silver demand, up from roughly 50% a decade ago. Silver has quietly crossed a threshold: it is now majority an industrial commodity with a precious metal overlay, not the other way around.
This matters enormously for how investors should think about it. Industrial commodities respond to economic cycles, technology adoption curves, and supply chain dynamics. Monetary metals respond to interest rates, dollar strength, and investor fear. Silver now does both — which is the source of both its complexity and its opportunity.
The three demand engines driving the shift
Industrial silver demand has grown from roughly 280 million ounces (Moz) per year in 1975 to 680 Moz in 2024 — but the pace has not been uniform. The rate of growth has accelerated dramatically in the modern era:
1975–2005 (30 years): demand grew by approximately 88 Moz total — roughly 3 Moz per year
2005–2024 (19 years): demand grew by approximately 312 Moz total — roughly 16 Moz per year
The acceleration is approximately fivefold. Three independent demand channels explain it.
Solar photovoltaics: the fastest-growing channel
Silver paste is used in virtually every silicon solar cell to conduct electricity to the external circuit. Solar PV grew from 11% of silver's industrial demand in 2014 to 29% in 2024 — nearly tripling its share in a single decade. With global solar installation targets still in early innings relative to net-zero pathways, this channel has structural momentum that is not dependent on any single policy decision or market cycle.
Electric vehicles and electrical power infrastructure
EVs use silver in power management electronics, charging systems, and sensors. The electrical power infrastructure — the transformers, switchgear, and connection points required to support both EV charging and AI data center power demand — uses silver in conductors where its unmatched electrical conductivity is difficult to substitute. This electrical power infrastructure channel is underappreciated in most silver analysis because it is less glamorous than solar panels or batteries, but it scales directly with electrification regardless of which EV architecture ultimately dominates.
AI infrastructure: the connection most analysts miss
This is the demand channel most directly connected to RichStorm's existing coverage. AI data centers require massive, reliable power. That power requires electrical power infrastructure buildout. Electrical power infrastructure buildout requires silver — in transformers, busbar systems, and switchgear — at a scale that was not part of the silver demand picture even five years ago. Unlike solar where material efficiency improvements are possible, the electrical conductivity requirements of electrical power infrastructure leave little room for substitution.
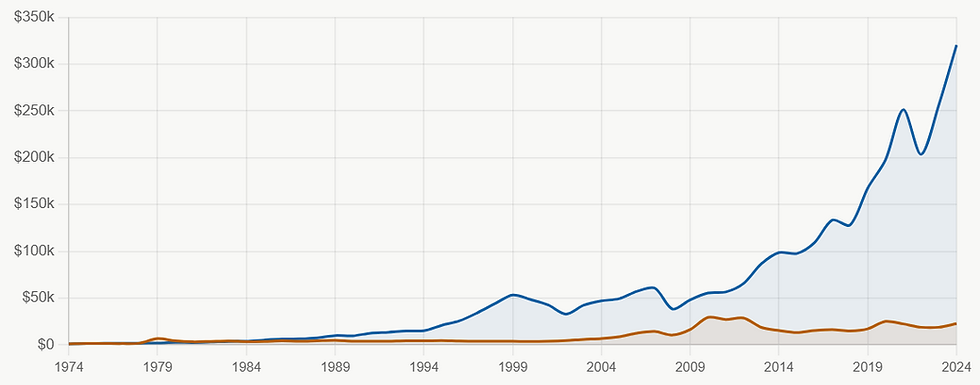
Chart 1: Silver Industrial Demand vs. Price (1975–2025)

This chart carries the most important analytical message in this report. Industrial demand has risen in a nearly unbroken upward trend for 50 years. Silver price has been wildly volatile, disconnected from that trend for most of the period, and driven by forces entirely external to industrial demand. The two curves have historically had almost no meaningful correlation — a point we quantify in Section 3.
Fifty Years of Price History: What the Data Actually Shows
Understanding silver as an investment begins with an honest reading of its price history — not the selective version that silver advocates typically present.
The 50-year price chart tells a story that is both more dramatic and more sobering than most silver commentary acknowledges. Three features stand out.
The 1980 spike was manipulation, not fundamentals
The Hunt Brothers — two Texas oil billionaires — accumulated over 100 million ounces of silver between 1979 and 1980, attempting to corner the global market and driving prices from roughly $6 to nearly $50 per ounce. When regulators broke the squeeze, prices crashed just as fast. This single event distorts the entire 50-year picture. It was a criminal conspiracy masquerading as a market signal.
Eighteen years of near-silence
From 1985 to 2003, silver traded in a roughly $4–$8 band for nearly two decades — despite a structural supply-demand deficit being documented and publicized throughout the entire period. This is the most important lesson in silver's price history: being right about the fundamentals does not produce returns if the market does not choose to price those fundamentals. Warren Buffett learned this directly.
The 2011 and 2025 spikes share a common architecture
The 2009–2011 move from $9 to $49 was not driven by a sudden worsening of the industrial deficit. It was driven by the Global Financial Crisis triggering a flight to hard assets and the Federal Reserve's quantitative easing program inflating commodity prices broadly. Similarly, the 2025 move to $71.60 — a genuine all-time high — was driven primarily by ETF investment inflows of 187 million ounces reflecting stagflation fears, dollar weakness concerns, and geopolitical uncertainty, at the same time that industrial demand actually ticked slightly downward.
The pattern
Every major silver price spike in 50 years has been triggered by monetary or speculative forces — not by the industrial demand story. Industrial demand is the slowly rising floor. Investor sentiment is the elevator.
The Correlation Question: Does Industrial Demand Drive Price?
A rigorous analysis of silver's investment case requires quantifying the relationship between industrial demand growth and price — rather than assuming one drives the other because they both trend upward over time.
We calculated the Pearson correlation coefficient between annual silver industrial demand and annual silver price across three time windows. The Pearson coefficient runs from -1 (perfect negative correlation) through 0 (no relationship) to +1 (perfect positive correlation).
Chart 2: Correlation Scatter Plot — Industrial Demand vs. Price (1975–2025)

The scatter plot is the clearest visual representation of this finding. The early-period blue dots cluster tightly in the bottom left — low demand, chaotic prices, no relationship. The modern-era orange dots spread vertically at similar demand levels, with prices ranging from $14 to $71 for nearly identical industrial demand figures. That wide vertical spread is the visual proof that forces other than industrial demand are setting price.
The statistical conclusion is unambiguous: industrial demand growth is not a reliable short-term or medium-term price driver. It establishes a slowly rising structural floor. It does not generate price moves.
The Copper Question: Why Substitution Is Slower Than It Looks
The most common pushback against a bullish silver thesis is the substitution argument: if silver becomes too expensive, industry will replace it with cheaper alternatives. In most commodity markets, this is a legitimate constraint on long-run price. In silver's specific situation, the constraint operates far more slowly than markets typically assume.
What the materials science record actually shows
Researchers and manufacturers have been working seriously on copper replacement for solar cell metallization for over a decade. The results in controlled laboratory settings are genuinely impressive — copper-based contacts have achieved efficiency levels matching or exceeding silver in experimental cells. The challenge is not demonstrating that copper can work. The challenge is demonstrating that it will continue to work reliably for 25 years in the field.
Solar panels are warranted for 25 years of outdoor performance through thermal cycling, humidity, UV exposure, and mechanical stress. Every change in metallization must survive that validation window before customers will accept it in commercial-scale procurement. Laboratory results from 2024 cannot certify a 2026 product for a 25-year warranty. This timeline constraint alone gives silver's solar demand a protected runway well into the 2030s at minimum.
The thrifting story: real progress, but approaching its limits
Where substitution has genuinely made progress is not in replacing silver, but in using less of it. The amount of silver per watt of solar capacity has fallen dramatically over the past 15 years — from roughly 400 milligrams per watt in 2010 to approximately 10–15 milligrams per watt today. This is a genuine materials engineering achievement.
However, the pace of this reduction has slowed noticeably in recent years as manufacturers approach the physical limits of screen-printing technology. Reducing contact line width further without degrading electrical performance or manufacturing yield is increasingly difficult. The low-hanging fruit in thrifting has been harvested.
What is actually happening in production: the hybrid compromise
The realistic near-term outcome the solar industry has landed on is not copper replacement but silver-coated copper paste — a hybrid approach that reduces silver content by 50–70% compared to pure silver paste while preserving the surface properties required for reliable electrical contact. This is commercially advancing now and will meaningfully reduce silver intensity per panel over the next 3–5 years.
Full copper metallization at commercial scale with a verified 25-year reliability track record is, on the most optimistic credible timeline, a late-2020s phenomenon. On a more conservative reading of the engineering challenges — copper diffusion into silicon, contact adhesion under thermal stress, yield stability at terawatt-scale manufacturing — it is a 2030s story.
The Supply Side: Why the Deficit Cannot Self-Correct Quickly
A structural supply deficit that persists for five consecutive years without triggering a decisive price response raises a legitimate question: if the deficit is real, why hasn't supply responded? The answer lies in the specific structure of silver mining — one of the most constrained supply responses of any major commodity.
The byproduct problem
Approximately 72–75% of global silver production comes as a byproduct of mining other metals — primarily copper, zinc, lead, and gold. This creates a fundamental disconnect: silver prices cannot incentivize increased production if the economics of the primary metal do not justify new mines. When copper demand slows and copper mines reduce output, silver production falls with it regardless of where silver is trading. Supply is effectively held hostage to the demand cycles of other metals.
The development timeline
New primary silver mines — where silver is the primary economic output — take 8–12 years from initial discovery to first production under realistic permitting and financing timelines. Years of suppressed silver prices before 2021 discouraged exploration investment during precisely the period when new supply pipelines should have been built. That absence of investment translates directly into a constrained supply outlook through at least the early 2030s, regardless of what prices do today.
The stockpile buffer is thinner than it has been in decades
When annual demand exceeds mine production, the market does not immediately face a shortage — it draws down existing above-ground inventories held in exchange warehouses and commercial vaults. This buffer absorbed structural deficits for two decades after Buffett's 1997 silver purchase without producing meaningful price pressure.
Since 2021, approximately 760 million ounces have been drawn from global above-ground stocks — equivalent to nearly one full year of global mine output. The buffer is not gone, but it is materially thinner than at any point in the modern era. Markets are becoming progressively more sensitive to demand shocks as the cushion continues to erode.
The Buffett Case Study: Right Thesis, Wrong Instrument
Warren Buffett's silver investment between 1997 and 2005 is the most instructive case study in silver investing history — not because it succeeded, but because it revealed the precise ways in which a correct fundamental thesis can fail to produce adequate returns.
Buffett's stated rationale was pure supply-demand analysis: annual consumption exceeded production by roughly 100 million ounces, and prices would have to rise to rebalance the market. He was correct. The deficit was real. The reasoning was sound.
He held the position for approximately eight years, during which silver drifted from roughly $4.50 to $7–8 per ounce — a modest gain for nearly a decade of commitment. He sold in 2005–2006. Silver then moved to $12.90 (2006), $16.99 (2009), $30.63 (2010), and peaked at $49 intraday in 2011. At today's prices, his 129.7 million ounce position would be worth approximately $4–5 billion versus the $910 million he paid.
The lesson
Buffett identified the right structural imbalance roughly 15 years before it drove a significant price response. He exited precisely before the payoff materialized. The deficit thesis was correct; the timing was off by a decade; and silver's failure to pay dividends or earnings while you wait makes patience structurally harder to maintain than in equities.
The Investment Thesis: What Has Changed and What Hasn't
With five decades of data, a quantified correlation analysis, and an honest assessment of substitution dynamics, we can now construct a thesis that is grounded rather than promotional.
Chart 3: Silver vs. S&P 500 — 50-Year Return Comparison
The long-run return comparison is unambiguous: the S&P 500 has dramatically outperformed silver over 50 years on both raw return and risk-adjusted return (Sharpe ratio approximately 0.43 vs. 0.09). Silver is not a replacement for equity exposure. This should be the starting point of any honest silver analysis, and it disqualifies silver as a core long-term wealth-building position.
What is genuinely different in 2026
Several structural conditions exist today that have not existed simultaneously in any previous silver cycle:
Industrial demand is growing at five times the rate of the pre-2005 era, driven by multiple independent channels simultaneously
The above-ground stockpile buffer has drawn down for five consecutive years to levels not seen in the modern era
The copper substitution escape valve faces a 25-year warranty validation constraint that protects silver's solar demand for at least another decade
AI infrastructure buildout creates an entirely new demand channel through electrical power infrastructure expansion that was not part of the silver picture even five years ago
Supply response is structurally constrained by byproduct economics and the 8–12 year development pipeline for new primary mines
What has not changed
The following conditions remain true and must temper conviction:
Price is still primarily driven by speculative and monetary forces, not industrial fundamentals — the 2025 all-time high is the clearest recent evidence
Silver has no earnings, dividends, or cash flows to confirm the thesis while you wait — patience is structurally more difficult than in equities
Volatility is extreme — silver has historically drawdown 60–70% from peak to trough even in secular bull markets
Thrifting and gradual substitution are real and will slow demand growth, even if they cannot stop it
Conclusion
Silver in 2026 has the strongest industrial demand foundation in its 50-year modern history. The copper substitution barrier is real. The stockpile buffer is thinning. The supply response is structurally constrained. These conditions are genuinely different from any previous silver cycle.
The most honest characterization the data supports is this: silver is a random walk with drift — largely unpredictable in the short run, with a real but slow upward trend over decades. The noise term is approximately five times larger than the drift in any given year. Trying to time silver is attempting to profit from the random component. The only reliable way to capture its return is to hold long enough that the drift dominates — a minimum 10-year horizon.
The investor who holds silver understanding this — sized to survive 30–50% interim drawdowns, patient for the drift, and not mistaking short-term noise for signal — has a defensible position. For how silver fits within an overall portfolio framework, see RichStorm’s Portfolio Construction Guide.
