Growth vs. Value: What a Century of Data Actually Shows
What “growth” and “value” actually measure, what history says about which wins — and why the last decade may be less of a pattern break than it appears
Prepared by Richstorm.co

KEY TAKEAWAYS
Growth and value are classifications based on forecast earnings growth, historical sales growth, and price-to-book ratio — not on how fast a stock's price has risen.
Value outperformed growth in 6 of 9 decades from the 1930s through the 2010s; the exceptions were the 1930s Depression era, the 1990s tech boom, and the 2010s — making the current decade only the second sustained growth-winning period in nearly a century.
Much of the recent growth/value gap may not be a category effect — it may be a handful of companies' extraordinary returns flowing through a style label, with NVIDIA alone now over 13% of VONG.
NVIDIA's revenue is real, but it reflects other companies' forward bets on AI's commercial future — one step removed from AI having delivered proven returns at scale.
In an era of internet-speed information, narratives about “the future” concentrate capital faster and harder than in previous decades — amplifying both the upside and the eventual correction.
A technology being real is a separate question from whether today's leading stocks are correctly priced: the internet was transformative, and Microsoft — its dominant company — still took 16 years to recover its dot-com peak.
History also suggests that sharp drawdowns in genuine technology cycles create buying opportunities: from the 2002 trough, the Nasdaq rebounded roughly 150% in five years — rewarding investors who understood the technology was real and stayed positioned to act.
Most investors have an intuitive sense that “growth” stocks are the ones whose prices go up fast, and “value” stocks are the slower, steadier ones. That intuition has been reinforced by a remarkable decade: growth-oriented index funds have dramatically outpaced their value counterparts since the mid-2010s. But the labels themselves describe something more specific — and the gap may have less to do with “growth” as a category than with a small number of companies whose extraordinary performance happened to flow through a particular index.
What the Labels Actually Mean
Index providers such as FTSE Russell classify every large company along a spectrum from “growth” to “value” using a formula combining three inputs: forecast earnings growth over the next two years, historical sales-per-share growth over the past five years, and price-to-book ratio. These produce a single “composite value score.” A company with high forecast growth, high historical sales growth, and a high price relative to book value ends up with a low score — classified as growth. A company with modest growth and a price close to or below book value ends up with a high score — classified as value. Roughly 30% of companies land in the middle and are split proportionally between both indexes.
Nothing in this formula measures how a stock's price will move going forward. It describes what kind of company it is today — how much future growth the market is already paying for — not what happens next.
A Decade of Lopsided Returns — and What History Actually Shows
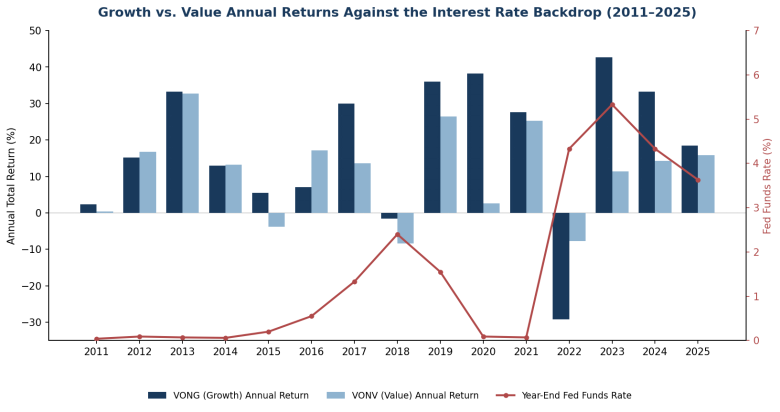
Over the past 10 years, VONG returned roughly 16.2% annualized while VONV returned roughly 8.7% — nearly double. That gap has reinforced the popular belief that growth is simply the better long-term bet. But looking decade by decade from the Fama-French data library tells a more complicated story. Value outperformed growth in 6 of the 9 decades from the 1930s through the 2010s: the 1940s (+8.2% edge), 1950s (+4.8%), 1960s (+2.4%), 1970s (+7.9%), 1980s (+3.8%), and 2000s (+4.6%). The two exceptions before the 2010s were the 1930s — where Depression-era dynamics drove unusual returns — and the 1990s, when growth led by 3.2% during the late-decade technology boom. Value then sharply reasserted itself in the 2000s as the dot-com bubble unwound. The 2010s represent only the second time in nine decades that growth has outperformed for a full decade — and the current gap is larger and more sustained than the 1990s episode.
Interest Rates: A Contributing Factor, Not the Full Story
The most common explanation is interest rates. A growth company's value sits mostly in distant future profits, making it behave like a long-duration bond — highly sensitive to rate changes. When the Fed Funds rate spiked from near zero to over 4% in 2022, VONG fell 29.18% while VONV fell only 7.66%, a result consistent with this mechanism. But the same data shows the limits of rate-driven explanations: in 2023, VONG gained 42.68% — its best year in 15 years — while rates stayed near their highest, around 5.3%. Interest rate shocks can trigger sharp repricing of growth stocks, but stable rates, at any level, do not reliably determine which side wins over multiple years.
The Real Driver: Concentration in a Handful of Companies
A more direct explanation starts from a simple observation: VONG's Magnificent Seven weighting is roughly 52%, and within that group, NVIDIA alone grew from a minor holding to over 13% of the fund, driven by extraordinary revenue growth during the AI buildout. That revenue is real — but it's worth noting what it reflects: Microsoft, Google, Amazon, Meta, and others collectively spending hundreds of billions on AI infrastructure, based on their own forward bets on AI's commercial future. NVIDIA's fundamentals are one step removed from AI having already delivered proven returns at scale; they reflect the industry's confidence in what AI will become, not what it has yet demonstrably produced. “Growth outperformed value” may be less a statement about a style category and more a statement about NVIDIA — and a handful of others — dressed in index language. Strip out the Magnificent Seven, and the growth/value gap over the past decade would likely look very different.
Why did this concentration happen in this particular decade? Narratives about which technologies represent “the future” have always driven capital, but they now spread at internet speed. Faster narrative spread produces faster, larger capital concentration into whichever companies represent “the future” at any given moment — for this decade, anything AI, software, or semiconductor-related. This dynamic amplifies both the upside while the narrative holds and the potential correction when it fades, shifts, or is displaced by a newer story.
What History Says: Technology Is Real; Prices Are a Separate Question
A technology being real does not tell you whether the companies currently tied to it are correctly priced. The dot-com era makes this distinction precisely. The internet was genuinely transformative — and Microsoft, the dominant technology company of that era, lost 58% of its value in the crash and didn't reclaim its 2000 peak until 2016, a 16-year round trip, despite remaining profitable and growing its business throughout.
However, the dot-com parallel contains an underappreciated counterpoint. From the October 2002 trough, the Nasdaq rebounded roughly 150% by 2007 — approximately 21% per year for five years. The 2008 financial crisis interrupted that recovery, but from the March 2009 low, tech compounded at over 20% annually through the 2010s. Investors who bought a broad technology fund at any point during the 2002-2012 window — without perfect timing, simply when the narrative had soured and prices had reset — captured some of the most extraordinary long-term returns in market history. The lesson from that period is less “tech is dangerous” and more “the crash created the opportunity.” If AI proves as durable as the internet, a meaningful valuation reset at some point would likely represent exactly the kind of entry point that rewards investors who understood the underlying technology was still real — and stayed positioned to act.


